

A field method for measuring solids sizes on the job. It is simple and easy to use and should improve the efficiency of solids control. There will be some sacrifice in accuracy; however, only the relative weight percentage distribution of the particles is needed to allow constructive steps to remove these particles.
Removing solids by dumping the mud into the reserve pit, or sump, is always costly and inefficient. The solids removal problem must be approached systematically. First, the given flow stream is analyzed to determine particle size, then the coarse particles are separated by screening; the next-size particles, in the medium or intermediate range, are removed by mechanical means; and the fine particles can be moved by flocculated settling particles can be moved by flocculated settling. In this way, process efficiency is assured.
Field Method for Determining Particle Size
After deciding how to classify solids according to size, the next step is to develop a procedure to measure particle sizes in the field. Although several laboratory methods are available they are complicated, not necessarily accurate, and require too much time to obtain results.
The present API designation of particle size is of limited use. In terms of volume percent, it defines as sand the particles larger than 74 microns, and as silt those smaller than 74 microns. This has become known as an abrasive test because it is based on the assumption that all solids larger than 74 microns are abrasive sand. However, this assumption is not necessarily valid. Some of the particles larger than 74 microns are nonabrasive, and some of those in the silt category are abrasive. Another breakdown for classifying solids is needed, since solids in a mud system can be from less than I micron to more than 3,000 microns. In addition, the solids content should be expressed as a weight percent rather than a volume percent. As noted above, the percent size classification percent. As noted above, the percent size classification does not indicate the nature of the particles definitively enough; however, it is still the only method of classification being used.
Table 1 is a suggested particle-size classification. In a weighted system, the same particle-size classification can be used by considering two specific gravities: 4.2 for barite, and 2.65 for the remainder of the solids. The suggested classification deals with size rather than type of solids since this is the most important criterion. Table 2 compares various common particle sizes to illustrate how small the ultrafine particle sizes to illustrate how small the ultrafine and colloidal mud solids are in relation to other common particles.


To choose the proper equipment, it is necessary to analyze the particle-size distribution in the mud at a given time. The return stream from each piece of equipment should be analyzed to determine what solids remains and require processing in the next stage of solids control. By using this procedure on a well being drilled, information can be obtained to select the proper solids control equipment for the next well in the area.

The procedure developed for ascertaining the amount of each particle size down to 44 microns, using vibrating screen (shale shaker screen), is outline in the appendix. The series of shaker screens to use in the analysis was chosen after testing many mud samples. It assures that plugging will not occur. The circular Tyler screens and vibrator are capable of handling viscous mud and mud of high solids content without difficulty, although water dilution is sometimes necessary. Certain of the screens may be removed or added to the series as necessary. Nomographs have been developed for field use to provide a qualified measurement of the total solids (Figure 2, 3, and 5).


The amount of particles smaller than 2 microns can be obtained by a methylene blue test, and the ultrafine category can thus be determined by subtraction. The mehylene blue test (API RP 13B, Sec.9.32) measures the cation exchange capacity of drilling mud solids, which is basically a measure of the equivalent benonite content of a mud. It is known that these particles are mostly less than 2 microns in size; thus the methylene blue test gives a quantitative determination of this particle size. The test is not completely accurate since some larger particles will exhibit a limited cation exchange capacity, and some particle below 2 microns will not exhibit a cation exchange capacity. However, it is accurate enough for field measurements.
Table 3 is an example analysis of a desander discharge stream to further illustrate how the particle-size distribution can be obtained. It is important to dry the solids before weighing them because of the weight of water involved and because the adsorbed film of water attracts particles. Adsorbed water can cause an error as great as 40 percent if the solids are small and therefore expose a large surface area. In the example given, there was 27 percent adsorbed water by weight.
When the weight percent of each particle-size category has been determined, it is helpful to plot the distribution to obtain a profile of particle size. The most satisfactory representation is one developed by darling, an example of which is show in Fig 1.
Material Balance Technique
Once he particular size range of the mud solids is known, the next step is to select the equipment to handle these solids and to determine how efficiently each piece of equipment is operating. To do this, a material balance technique is used. A balance can be run on shale shakers, cyclones (mud cleaner, desander, desilter) or decanter centrifuge, provided care is exercised in sampling. Of course, to balance weighted systems, two specific gravities are required,and the technique is slightly more complicated.
In any piece of solids to be control equipment the stream containing the solids to be processed will be called the feed stream, or stream No. 1. The stream that goes back into the mud system will be called the return stream, or Stream No. 2. The stream that is being discharged or thrown away will be called the discharge stream, or Stream No. 3.
A material balance can be obtained if we know only four of the six unknowns. For example, knowing one flow rate and three weights, or three flow rates and one weight, we can calculate the other two unknowns.
In a hydrocyclone operation the feed stream comes from a centrifugal pump with a buried suction and is thus difficult to measure accurately. The flow rate of the return stream is also hard to measure, since it is high. However, this rate can be obtained if a large enough measuring tank is used. The flow rate of the discharge stream is normally low enough that it can be measured fairly accurately. Samples for weight can be obtained at the feed, return, and discharge. It is important that the samples be representative and that the weights be measured carefully. It should be pointed out that we are concerned with the weight of only the solids and not the water.
In balancing the shale shaker, it is best to use a measured return flow rate if possible or a calculated circulation rate for the feed stream. The discharge rate for the shale shaker is almost impossible to measure because only solids are being’ discharged off the screens with adsorbed water.
In balancing a decanter centrifuge, the rate of the 0 to 5-micron fluid discharge (Stream No. 2) is the only rate that can be measured accurately. The larger solids discharge stream (Stream No. 3) is extremely viscous and therefore difficult to measure. The feed stream (Stream No. 1) is supplied by a Moyno pump and is also difficult to measure.
A solids settling tank can be balanced using only the rate flowing out of the tank and the change in solids content of the stream from inlet to outlet.
Two nomographs have been prepared (Figs.2 and 3) for determining pounds of solids in 1 gal of slurry. Fig.2 covers flow rates up to 100gal/min and is used for low-flow-rate stream such as the discharge stream from a hydrocyclone. Fig. 3 covers flow rates to 1,500 gal/min and is used for the high-flow-rate stream such as the feed and return. The nomographs also provide the solids rate in pounds per minute.
Normally, the first thing to determine is the rate at which the solids are removed from the mud system. The next thing to determine is the concentration of solids in the feed stream. Further, one must determine what portion of the solids entering is being removed, and what portion is being returned to the system.
It is possible to determine the amount of particles in each size range being removed by using the flow rates and the percentage of solids in each stream that fall in a particular category. The solids in each stream must be analyzed to determine the percentage of that solids size range in each stream.
To further illustrate the use of this technique, example calculations on a hydrocyclone balance are provided in Fig. 4.
From the example provided, the median cut would be somewhere in the fine category at 60 microns. Expressing the median cut, however, is somewhat meaningless, since the median reflects the parcel size range that comprises only 17 percent of the particles. A more meaningful statement would be that the hydrocyclone is removing 6 percent of the ultrafine particles, which constitute 56 percent of the solids in the mud (Stream No. 1); that is, it would be more meaningful to express the percent removal of each solids category, as shown in the discharge stream (No. 3) in Fig. 4.
The example in Fig. 5 shows that 18 lb of solids is being generated each minute in drilling at 8 ft/hr in a 12-1/4 in. hole. This is adding 0.04 lb/gal to the mud weight when circulation is at 500 gal/min. if the penetration rate were 50 ft/ht, we would be adding more than 100 lb of solids per minute to the mud system, or 0.2 lb/gal more mud weight at the same flow rate. If these solids are not being removed at the surface, the mud solids content will increase and the mud weight will rise.
If solids are not being removed efficiently, it is probable because they are so fine that the mechanical solids control equipment cannot efficiently remove them and they are re-circulated and broken down into even smaller particles. An analysis of the solids categories in the mud at the well outlet and at the feed streams going into solids removal equipment will indicate what the predominant particle size is and what proportion the equipment is removing. If these particles are not being efficiently removed, the proper equipment must be selected to remove the particles of predominant size sequentially, starting with the largest particles.


A solids material balance can be determined in the field with: (1) a set of vibrating screens, (2) the methylene blue test kit, (3) a mud balance, and (4) the solids nomography (Figs. 2, 3, and 5). If there are solids removal problems at a given location this approach will determine where the problem lies and indicate constructive steps to rectify the situation. From this example test and many others, conducted on 6 in. hydrocyclone, we conclude that cones of this size cannot remove very much of the ultrafine solids. If this type of analysis had been performed on the well, it would have been obvious that a 4-in. hydrocyclone would be more effective for use on the next well in the area.


FIELD MUDS, EXPRESSED IN PERCENT BY WEIGHT
Solids Generation
To handle solids removal on the surface we must know the amount of solids being generated as drilling proceeds. The nomograph shown as Fig. 5 provide a means of measuring the pounds of solids being generated per minute vs the penetration rate and the pounds of solids that are being added per gallon of mud, according to flow rate. Of course, the accuracy of this nomograph becomes somewhat questionable when the hole is sloughing or when the cuttings are not being cleaned from the hole. Thus, this calculation us only a relative indication of the solids being put into the mud system for a given penetration rate.


By determining relatively how many solids are being added to the mud system during drilling, and comparing this with the cumulative solids removal rate of several pieces of equipment in the surface circulation system, the efficiency of the over-all process can be determined.
In evaluating the efficiency of a solids removal system, the solids being removed must be equated to the solids being produced. The lower the efficiency, the more dilution required to maintain a given mud weight. The mud maintenance costs will also increase in direct proportion to a lowering of the solids removal efficiency.


Result
A number of field mud systems were analyzed using the suggested solids classification. Four of these systems are shown in Table 4. The suggested classification groups the particles in categories that are more descriptive than those obtained by the present API method of dividing at the 74-micron level.
Extensive analysis indicates that most of the solids found in presently used field mud are in the ultra-fine category, smaller than 44 microns. In the four mud analyzed in Table 4, an average of 67 percent of the solids were in this category, This is primarily because the solids are re-circulated and are continuously broken up into finer particles. Insert bits and diamond bits generate finer solids particles than do bits with conventional teeth; also, soft upper shale sections break down into very fine particles. Thus, the result, after a number of days of drilling, is a high concentration of ultra-fine particles in the mud system.


Since drilling solids have an adsorbed film of water that causes particle attraction, finer particles are attached to larger particles or are held together to form a larger particle (see Table 3). The retention effect is particularly noticeable with flocculating polymers. This is one of the reasons why more solids are removed by the shale shaker screen when polymer mud are used. With dispersed mud there is less particle attraction, so the particles remain smaller and are more difficult to remove.


Table 5 provides field examples of material balance calculations, on a total solids basis, from various pieces of equipment on different wells. These examples are not shown in detail as to each solids category, but they do demonstrate that the effectiveness of solids removal can be easily analyzed for any piece of equipment.
There is still a large percentage of fine and ultrafine solids left in the mud system after it has passed through the shale shaker, the desander, and the desilter. Of course, the bentonite or coI1oidal solids are also left in the mud, but this is desirable. The only practical way to remove the remaining undesirable drilled solids is to settle them and dump them out of the system. The existing flat-bottom circulating tanks are highly inefficient for this operation. Therefore, solids settling tank is proposed to improve the removal of very fine mud solids.


Recommended Circulating System
Solids Settling Tank
A design for a solids settling tank (Fig. 6) was developed from extensive testing of scale model in the laboratory. Laboratory prepared mud containing various amounts and sizes of drilled solids were used, as were mud obtained from actual field mud system. The tests demonstrated that the tank was capable of removing 60 to70 percent of the total solids in a mud system. The efficiency varies somewhat, depending on the properties of the mud and the concentration of the solids. At minimum efficiency in thick mud of high solids content, 30 percent of the solids were removed. This contrast with field tests of actual performance on existing circulation systems in which, on the average, only 10 percent of the total solids were removed. These field tests included both the mechanical removal and the settling of solids in the surface pits. This comparison of removal rates is based on one pass through the surface circulation system and the solids settling tank.
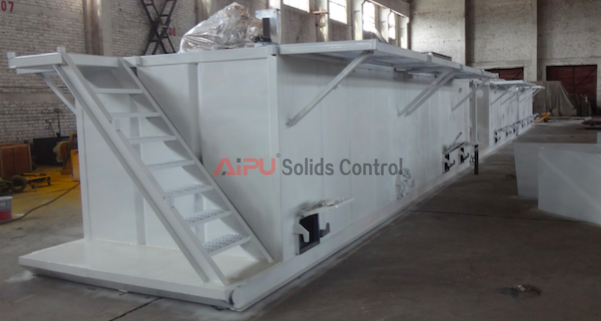

The tank prototype is a scale model of a 210-bbl field tank. The final version of the field tank, which has now been completed, can be made entirely automatic. This is a great advantage, considering the difficulty of training personnel to dump the settled solids systematically and efficiently. In extreme climatic conditions, such as in the Arctic, automation would be particularly helpful.
The vertical solids-settling tank is placed in the surface circulation system where solids would normally be settled in a horizontal surface tank. It is fed by a centrifugal pump, which overcomes the 15 ft of head. Because the circulation is at a somewhat higher rate than in normal down-hole operations, a bypass is needed. It appears that the circulation rate through the tank for most normal low-solids mud systems would be about 1,000gal/min. This would vary somewhat, depending on the penetration rate rate, the circulation rate, the amount of solids, and the viscosity of the mud system.
The mud enters at the bottom of the tank and is discharged at the top. A flocculants solution is introduced into the mud stream before it enters the tank. The mud rises through the tank and is forced to flow over the flow diffusers, across the inclined flow plates and the baffles, where sufficient shear is obtained to allow the solids to settle behind the baffles onto the plate. From here the solids slide down to the center of the plate and then to the solids drain. From the drains, the solids fall to the bottom and are subsequently dumped. The hopper arrangement on the bottom will allow the settled solids to be dumped without losing good mud. On the bottom of the hopper is a hydrostatically actuated valve that dumps the solids automatically. In thick, viscous mud, water must be added. The water, which can be added through jets located behind each baffles, lowers the viscosity and shears the mud so the solids will settle more readily. This added water will also flush the settled solids down the plates to the drain. The jets can be used for steam injection to clean out the tank in cold weather prior to a move.
The tank is inexpensive to build, relatively maintenance free, and can be incorporated into existing rig circulation systems with very little di5iculty. With skids mounted on the side and bottom, it is easily transported by truck, and is not subject to damage as is some mechanical solids removal equipment. This solids settling tank for removing fine and ultrafine drilled solids makes the solids removal system complete.
Optimum Rig Circulation System
As the mud leaves the well, carrying its load of drilled solids, it is processed to remove those solids. First, the shale shaker removes the largest particles. Second, the next-largest solids are removed by the desander, and an intermediate cut is taken by the desilter. Then the mud goes to the solids settling tank for the final cut before going to the suction tank and down the hole. If a decanting centrifuge is being used, it can be put between the solids settling tank and the suction tank, or in front of the solids settling tank, depending on which stream is to be saved.
Chemicals as well as water and oil should be added close to the flow line of the well rather than in the suction tank. This facilitates thinning the mud to improve solids removal, both in the mechanical equipment and in the solids settling tank. In addition, the mud is more uniformly mixed before it reaches the suction tank. Water can also be added through the nozzles in the settling tank.
Conclusions
It is possible to achieve solids control by following the analytical approach. These are steps involved:
- Analyze the solids content in terms of particle size for any give flow stream.
- Classify the solids into the proper size category.
- Plot the particle distribution profile to see where the solids concentration is.
- Determine the performance of each piece of solids control equipment by material balance.
- Equate the rate at which solids are being generated to the total rate at which they are being removed.
- Be certain to follow the recommended approach with respect to the order in which the solids are removed.
- Where solids removal is indicated by the forgoing steps to be inefficient, adjust or replace individual equipment to achieve satisfactory performance.
It should be noted that until more data have been collected by the technique described, we do not know what performance efficiency can be considered satisfactory.
