

Particles in dry bulk materials come in a wide range of forms, sizes, surfaces, densities, and moisture contents.
When attempting to forecast shaker screen performance, each circumstance must be considered due to its influence on capacity in terms of weight moving through a certain screen opening per unit area.
The combined effects of particle shape, surface texture, and surface or internal wetness on screen performance, or “screenability,” are beyond the grasp of empirical answers based only on size and density, which are independent of these factors.
Actual laboratory testing will provide more precise information on their impact.
SIZE AND SHAPE
The shape of an individual granule may be angular, spherical, acicular, ovaloid, flaky, or slabby. They can be mixed in the same material, as sawdust in wood flakes. Separation cutpoint sizes in most screening applications range downward from 4” to 325 mesh (.0018”).
The cutpoint defines the minimum particle size retained on the screen, and the maximum undersize particle passing. Unless the particle is acicular, platy, ovaloid or a perfect sphere, it will probably (but not necessarily) be sized by its largest dimension.
DENSITY
For any given shape and size distribution, bulk density in lb./cu. ft. (PCF) for any material will be directly proportional to its specific gravity. Screening is essentially a volumetric measurement, but capacity, or the rate of passage through the screen, is typically charted in units of weight per unit time, based on a standard bulk density of 100 PCF.
The actual rate for a material of different bulk densities then has to be adjusted by the ratio PCF:100. Tables of bulk density for various materials can be found in most material handling publications.
MOISTURE
Moisture in granular particles may be absorbed, adsorbed, or both. Either condition can impair screenability, but tolerance is much greater for internally absorbed than for external surface moisture. Surface moisture causes particles to stick together, resisting stratification.
Allowable surface moisture for unimpaired dry screening of inorganic granular or pelletized particles ranges from bone dry for screen openings below 20 mesh to 3% for 1/4” openings. Absorbed moisture in permeable soils such as ground clay can block the screen openings with cumulative buildups of extreme fines attached to the screen wires. Absorbent grains such as corn, soybeans, wheat, etc. will screen freely after drying to 13-15% internal moisture.
Screening of wood chips, flakes, and sawdust is unimpaired up to about 30% internal moisture; however, in laboratory tests with sawdust, efficiency was reduced by almost 60% when moisture was increased to 68%.

SIZE DISTRIBUTION
The size distribution of particles in a granular bulk material is the primary characteristic that governs the rate of undersize passage through a screen opening that is larger than the smallest particle and smaller than the largest particle in a representative sample of the material.
Size distribution is measured by sieve analysis, using a series of standardized wire mesh sieves with square openings that progress, in the commonly used Tyler standard scale7, at the fixed rate of 2 ROOT SQUARE from 1.05” to .0029” (200 mesh).
The size distribution is expressed as the weight percent of each fraction between successive sieves in a series. If the weight is plotted on the y-axis against the mean size of each fraction on the x-axis, the result will resemble a frequency distribution curve.
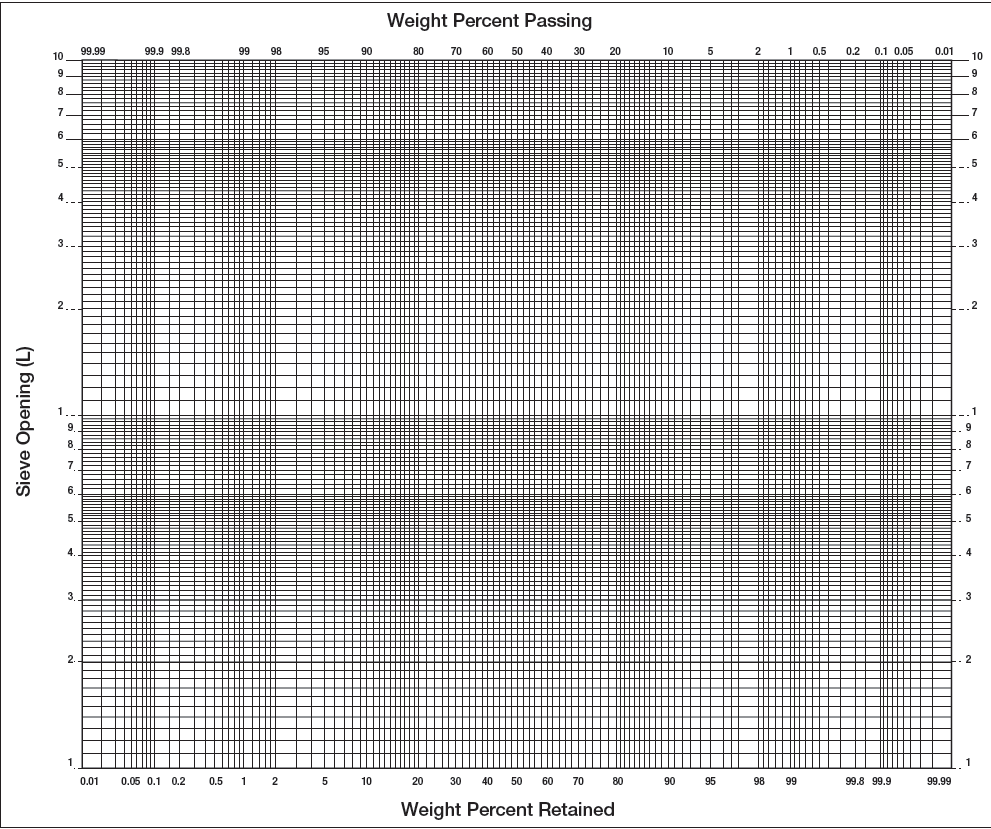
A more useful graphic form is the logarithmic probability grid, using a two-or three-cycle log scale as the ordinate and the probability scale as the abscissa. Tyler Standard Screen openings are spaced equally on the log scale (y-axis), and the cumulative weight percent retained (or passing) on the probability scale (x-axis).
The expansion of the probability scales outward from the mean emphasizes the extremes of the particle size distribution. Prints of this grid, shown in Fig. 1, can be obtained from the Internet. Fig, 2 is a sieve analysis of a sample of comminuted limestone plotted on this grid, using the ordinate for the sieve opening and the probability axis for cumulative weight percent passing or retained on each sieve in the series.
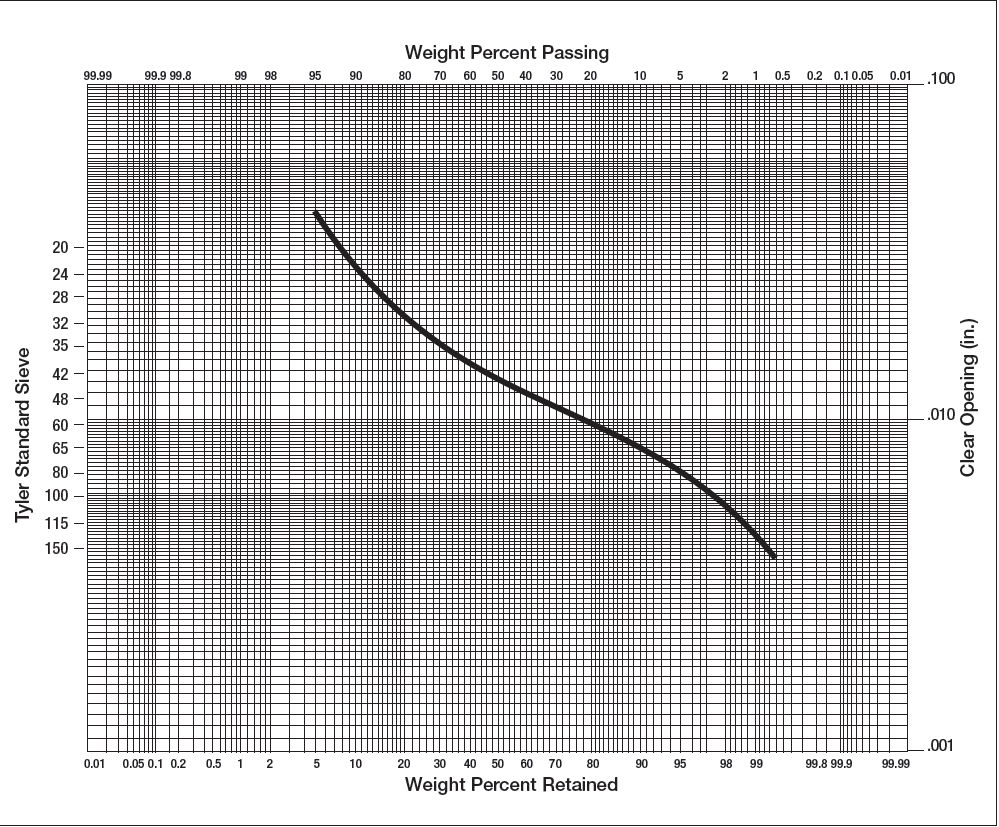
A different distribution, for a sample of natural sand from a “frac” sand deposit, is shown in Fig. 3. These two sieve analyses can be used to illustrate the influence on screen performance of differences in particle size distribution.
A “cutpoint”, at the intersection of a line drawn horizontally from the y-axis, and a vertical line from the x-axis, defines the percent of the feed that passed the selected opening in the test sieve used for the sieve analysis.
This is the reference for calculating the efficiency of any other screen having the same opening. The test procedure is designed to allow all the particles that can pass the opening sufficient time to get through, recognizing that, as the effective particle diameter approaches the screen opening dimension, the chances for it to get through the opening diminish as the square of the difference between them.
The rate of change of this difference is expressed in the slope of the distribution curve as it passes through the cutpoint. In practical applications, as the rate increases (slope becomes steeper) the decreasing proportion of particles approaching the opening dimension has two benefits:
- the cutpoint becomes sharper, with consequent improvement in separation efficiency;
- it may allow for an increased opening dimension, improving yield in the fraction under the desired cutpoint, without exceeding specified oversize limits.
As an example, refer to Fig. 2, the sieve analysis of a sample of comminuted limestone.. The curve slopes steeply between about 8 mesh and 48 mesh. If the desired cutpoint is within that range, at 28 mesh, and the screen opening is increased one full interval on the Tyler scale, to 20 mesh, the undersize fraction in the feed will increase from 64 to 67%, from the addition of the 3% 20×28 m. fraction.
While the probabilities of the passage of all particles 28m and smaller are improved by the larger opening, thus increasing the undersize yield, the probability that a 28m. particle will be found in the undersize has only been increased from zero to 1 chance in 30.
Compare this with the flatter distribution of Fig. 3. If the desired cutpoint is set at 28 mesh, at 84% passing, and the screen opening is enlarged one interval to 20 mesh, the undersize fraction in the feed will increase by 8%, to 92%.
The probability for passage of the 28 mesh particle into the undersize remains the same as in the previous example, meaning that the potential for exceeding a specified limit for oversize in the undersize fraction is almost 3 times greater for the flatter distribution.
As a general rule, screen capacity at any given level of efficiency, other things being equal, will be dependent not only on the size of the aperture but also on the slope of the size distribution curve through the cutpoint. This latter characteristic is taken into account in the test-data-based Fractional Efficiency calculations. The Capacity Estimating Methods, at a baseline efficiency of 85%, include correction factors for variances in the slope of a known or assumed size distribution.
