

Drilling operations are highly dependent upon reliable shale shaker to perform efficient drilling operations. Suitable drilling fluid quality, efficient solids removal and low waste production, as well as health, safety and environment (HSE), especially of working environment (WE) in the shaker room, are all respects relevant for selection and skills operation of shale shaker in the oil industry. More :(Criticality Testing of Shale Shaker (1)) and (Criticality testing of shale shaker (3))
Drilling-Fluid-Processing Capacity.
The results from the capacity test illustrate that oil-based drilling fluids typically are easier to process than water-based drilling fluids, and all shakers except one obtained a higher capacity with oil-based drilling fluid (Fig. 2). The highest flow rate for oil-based drilling fluid is 3950 LPM, and the highest for water-based drilling fluid is 3320 LPM. One shaker has a pronouncedly higher processing capacity than the other shakers. The lowest drilling-fluid processing rates are 1150 LPM for oil-based and 900 LPM for water-based drilling fluid.


drilling fluid (WBM) for the various solids-control equipment.
Please note that the maximal capacities found on the shaker test represent maximal flow for the drilling fluids used in the shaker test. The variation of the results indicates a difference in the drilling-fluid-processing capacity of the participating shakers.
Filtration Efficiency.
The analysis of PSD was performed to assess the filtration efficiency of the shakers. In the beginning, the PSD analysis was performed with the Malvern instrument, and the D 90 results of the PSD analysis are shown in Fig. 3. As drilling fluids are added with significant amounts of weighting material that has the majority of particles in the lower size range (less than 70 lm), this would mask the filtration-efficiency results. The samples of drilling fluid were therefore prepared for analysis by the removal of the largest and smallest particles by sieving because the instrument provided relative measurements of the number of particles only.
The results from the Malvern analysis were, however, inconclusive; only minor differences in PSD from the drilling fluid going into the shaker (inlet) and coming out from the shaker (outlet) were found. This is a result of the huge number of barite particles in the fluid, thus masking the true PSD of the drilling-fluid samples (Fig. 3).


shakers.
Because of the inaccurate data representation with the Malvern instrument providing relative PSD only, it was decided to analyze PSD with the FBRM. This instrumentation has been used extensively at both laboratory and field conditions and has demonstrated accurate particle-sizing measurements. The FBRM also provides the possibility of representing the particle count for the specific size range of interest.
The advantage demonstrated by the FBRM analysis indicates that this instrument should be used more in future PSD analysis, and this experience may be useful for both drilling operations and further research projects.
The drilling-fluid samples analyzed by FBRM were samples parallel to the ones analyzed by the Malvern instrument. With API 170 screens on the lowest shaker deck, it is expected to achieve a D100 separation from the drilling fluid of the particles larger than 82.5 to 98.0 lm (API 2010); see the PSD results in Figs. 4 through 6.
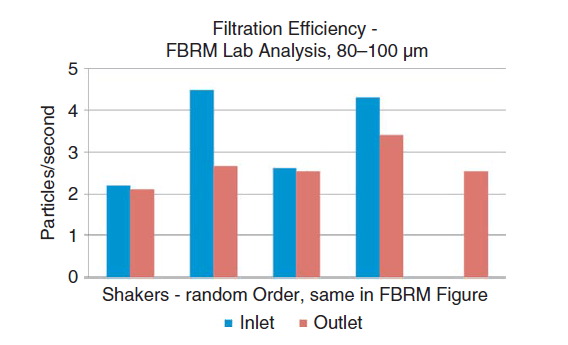
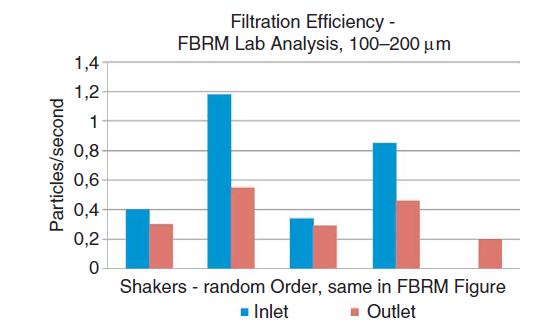
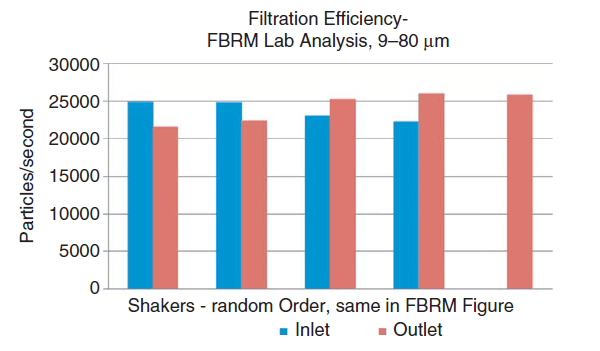
The blue columns represent the drilling fluid coming into the shaker (inlet), and the red columns represent the filtered drilling fluid coming out of the shaker (outlet). The particle counts from the outlet samples (red columns) in Figs. 4 through 6 are of most interest, being taken from filtered drilling fluid.

The blue columns in Figs. 4 through 6 that represent the drilling fluid coming into the shaker (inlet) display, thus, varying the content of particles (barite and sand). The variation in solids loading in the inlet-samples content may have been caused by different sample-collection points in the central or peripheral flow at the shaker inlets.
On one of the shakers, it was not possible to collect samples from the inlet; thus, only the PSD result from the outlet from this shaker is presented in Figs. 4 through 6.
The test results show that all shakers in the test have a satisfactory removal of particles in the size interval just above the designated cutpoint (Figs. 4 and 5). As expected, the removal of particles is higher in the size interval 100 to 200 lm, but there is a corresponding lower content of these larger particles in the drilling fluid going into the shale shaker. The test results in Figs. 4 and 5 indicate that the D100 for the particles sized 100 to 200 lm is a theoretical value because all shakers in the test have particles of this size interval in their outlet samples.

Even though the results are satisfactory for all participants, some shakers have a somewhat higher particle count in the size ranges 80 to 100 lm and 100 to 200 lm. This higher particle count in some shakers may be related to more extensive screen wear in these shakers.
Particles reduction was also observed on 9- to 80-lm particles (Fig. 6). The reduction of the coarser particles is expected, but not of the finer particles. These fine particles are expected to remain in the drilling fluid. This phenomenon is often described as the “piggy-back effect” in which finer particles attach to the coarser ones and are thereby removed from the fluid system.
Adherence on Cuttings.
Adherence of drilling fluid on cuttings was measured by retort analysis as OOC by an external laboratory; see results in Fig. 7.


All shakers seemed to be performing adequately; best OOC result is 3% W/W, and poorest OOC result is 8% W/W.
Retrieving representative drilling fluid and cuttings samples is often a challenge, and the results of the filtration-efficiency tests should be used as indication only, and a further investigation of filtration efficiency will require a higher number of samples to be collected and analyzed.
Screen Wear.
In these shaker tests, screens were inspected before and after test runs. The holes and number of plugs used to seal off holes were registered after each test (Fig. 8).


These screen-wear results are influenced by how many screens the supplier brought to the test, but these observations were performed during the test and the number of holes, no holes, and number of screens with plugs were as displayed in Fig. 8. There is large variety in the percentage of screens with holes—from 100% intact screens down to 33% only.
More data on screens and screen wear were collected during the test, such as a tendency to corrosion, clogging of screens by solids, method for patching screens, and the characterization of holes (rips, abrasions, size, position, and more). These data are, however, too detailed to be included here.
Leakage.
Leakage tests were performed to detect the average leakage rate that can be expected during drilling operations by each shaker. Both static- (equipment turned off) and dynamicleakage (equipment running) tests were performed; see leakage rates in Fig. 9.


The leakage rates for the four conventional shakers are relatively similar, between 2.5 and 3.5 LPM, on both the static and the dynamic test. No leakage was observed during the alternative leakage test of the vacuum-technology shaker. See Fig. 9 for results of the leakage tests. The static test was performed only on the alternative solids-control unit.
One of the shale shakers on the test turned out to be a demo unit that had the final quality check that was performed before offshore installation. This shaker needed adjustments to avoid excessive leakage, and after the adjustments, this shaker had good leakage results. This incident brings out the importance of a quality check before the installation on a drilling facility.
LCM-Recovery Function.
An LCM-recovery demonstration was performed for shakers as an optional part of the test because not all the participating shakers have this function. Three of the shakers performed a successful demonstration of the LCM function, in which the LCM particles added to the drilling fluid were screened out and recovered.
Operation and Maintenance Friendliness and Screen Wear.


The operation and maintenance check was performed while the shakers were installed and running in the test center. The performances of the shakers are ranked by a scale from poor to excellent; see summary of results in Tables 2 and 3.
| TABLE 2—OPERATION AND MAINTENANCE TEST, PART ONE | |||||
| Operation and Maintenance | Screen | ||||
| Shakers, Random Order | Access Daily Maintenance | Inspection of Screens During Operation | Need for Lifting Equipment During Maintenance | Ease of Replacing Screen | Operation Time To Change Screens |
| Excellent | Excellent | Yesa | Excellent | Excellent | |
| Excellent | Excellent | Yesa | Excellent | Excellent | |
| Excellent | Poor | Yesa | Excellent | Excellent | |
| Excellent | Excellent | Yesa | Excellent | Excellent | |
| Excellent | Excellent | Yesa | Good+ | Excellent | |
| aUse of lifting equipment only necessary when engine is lifted. | |||||
| TABLE 3—OPERATION AND MAINTENANCE TEST, PART TWO | ||||
| Cleaning of Screens and Bottom Tray | Possibilities for Adjustment | |||
| Shakers, Random Order | Cleaning of Screen | Cleaning of Bottom tray | Adjustment of Flow and Cuttings | Robustness |
| Excellent | Excellent | Good | Excellent | |
| Excellent | Excellent | Excellent | Excellent | |
| Excellent | Good+ | Excellent | Excellent | |
| Excellent | Excellent | Excellent | Excellent | |
| Poor | Good | Excellent | Excellent | |
Some shakers have a limited possibility to observe screens during operation because of the narrow opening between the decks, which may also be a benefit because the shaker operator has to pull out the screens to allow a better visual inspection of screen wear and to observe them. Some shakers have very tight anchorage solutions for the screens that require that force and special tools sometimes have to be used. The cleaning of the bottom tray and the screens is less convenient in some shakers, and cleaning requires extra attention.
The overall result for the participating shakers is that the maintenance and operation friendliness are prioritized in the design of the shakers. All five vendors have good products, and each of them can be recommended on the basis of operational, access, and maintenance solutions.
related reading: Criticality Testing of Shale Shaker (1)
Continue reading : Criticality Testing of Shale Shaker (3)

One Reply to “Criticality Testing of Shale Shaker (2)”
Comments are closed.