Cut points are used to indicate the separation characteristics of solids control equipment at a given moment in time. The performance of the equipment, in addition to the condition of the drilling fluid, should be taken into consideration in the assessment of cut point data. Cut point curves are derived from the collected data and indicate, at the actual moment of data collection, the percentage of chance that a particle of a particular size can flow through or be discarded by the solids-control equipment. Therefore, the cut point curve is a function of the physical properties of the solids (i.e., density), particle size distribution of the solids, physical condition of the solids-control equipment (i.e., sealing capabilities), and the drilling-fluid properties.
Cut points may be determined for all drilled-solids removal equipment. The mass flow rate of various-size particles discarded from the equipment is compared with the mass flow rate of the same-size particles presented to the equipment. When testing a particular unit, knowledge of the feed flow rate to the unit and the two discharge flow rates are required. The density of the feed flow multiplied by the volume flow rate provides the mass flow rate into the unit. Discharge mass flow rates are also calculated by multiplying the density of the stream by the volume flow rate. Obviously, the sum of the discharge mass flow rates must be equal to the feed mass flow rate. Usually one of the discharge flow streams is discarded and the other is retained in the drilling fluid.The material balance—both the volume flow rate balance and the mass flow rate balance—should be verified before measuring the particle sizes of the various streams.
Solids-removal equipment removes only a very small fraction of the total flow into the equipment. For example, a 4-inch desilter processing about 50 gpm of drilling fluid will discard only about 1 gpm of material. Since the discarded material is such a small proportion of the total material processed, the difference between the retained stream and the feed stream is difficult to measure. For this reason, more accurate data are acquired by mathematically adding the value of the discarded solid concentrations to that of the retained solids concentration to determine the feed solids concentration.
To determine the mass flow of a particular-size particle in the feed (or retained) stream and the mass flow of the same-size particle in the discard, flow rate measurements and solids concentrations are needed. The discard volume flow rates are normally relatively low, but the feed rates require using a flow meter or a positive displacement pump.
For shale shakers, the feed to the shaker will be the circulating rate coming from the well. Mud pumps must be calibrated to provide an accurate feed rate. While drilling, move the suction from the suction tank to the slug tank and measure the rate of drop of the fluid leaving the slug pit. The fluid in the slug tank will contain liquid and gas (or air), so the volume percentage of (%vol) gas must be subtracted from the volume of fluid leaving the slug tank. The %vol gas is calculated by dividing the difference between the pressurized mud weight and the unpressurized mud weight by the pressurized mud weight and multiplying by 100. If the desilters or centrifuges are fed by centrifugal pumps, some type of flow meter will be required to accurately determine the feed rate. The flow meter could be a large container whose volume is calibrated and a stopwatch. A centrifuge underflow volume flow rate is difficult to measure because of the high concentration of solids. A barrel or other large container can be split vertically and support beams or pipes welded to provide a support when the container is placed across the top of a mud tank. Calibrated lines are painted inside of the container to provide volume measurements. A quantity of water is placed in the container and the container is positioned adjacent to a decanting centrifuge mounted on top of a mud tank. The stopwatch is started when the container is pushed under the centrifuge, and the rate of water level is observed.
The known volume between lines and the time permit calculation of the volume discard rate. Representative samples of the underflow or heavy slurry provide the density measurements of the underflow. After confirming that there is a mass and volume flow balance with the measured values, the particle sizes in the discharge streams are determined.
All of the discard stream may be captured for analysis during a period of several minutes. The contents of the feed stream during that period must be known so that the ratio of discard to feed particle mass can be determined for various particle sizes. The feed stream and retained stream for shakers and desilters, however, would require much larger containers, and it is impractical to try to weigh or measure their volumes directly. Representative samples of the retained stream must be used to determine the mass of various-size particles.
With the centrifuge and the desilters, the particle sizes must be measured with an instrument that discerns particle sizes as small as 1 micron. With the shaker measurements, sieves may be used because the cut point range will be within the range of screens standardized by the American Society for Testing and Materials (ASTM). A variety of different laboratory devices are available that measure small-diameter particles. Instruments using lasers are popular in many laboratories.
The discard sample will contain the solids and the liquid phase of the drilling fluid. With the shale shaker discard, the mass of solids retained on each ASTM test screen may be measured directly by weighing the solids after they are dried. With the desilter underflow and the centrifuge underflow (or heavy slurry) discharge, the density of the solids must be used to determine the mass percentage of solids.
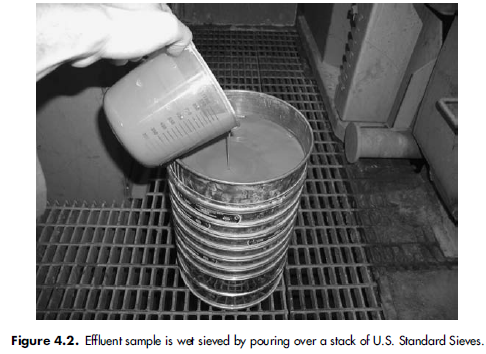
Cut points for shale shakers are measured by determining the particle size distribution of the feed and discard streams with the use of a stack of U.S. Standard Sieves. The flow rate of each stream is determined, and the mass flow rate for each sieve size in each stream is calculated. The mass flow rate of the discard stream for each sieve size is divided by the mass flow rate for the same size introduced into the equipment in the feed stream.
Using this method, the feed-stream sample represents a small fraction of the total overall flow. This can create a problem with material balances. A better method is to sample the discard and underflow streams. Combining these two solids distributions will yield a more accurate cut point curve. This method can be used on solids-control equipment in which the feed-stream flow rate is greater than the discard stream.
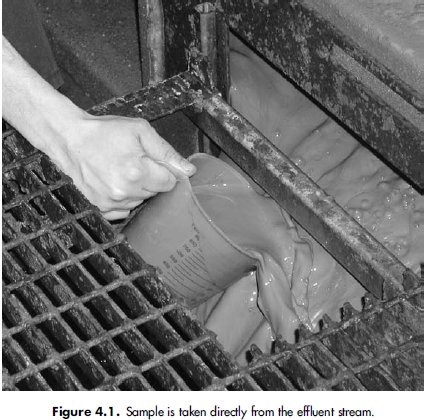
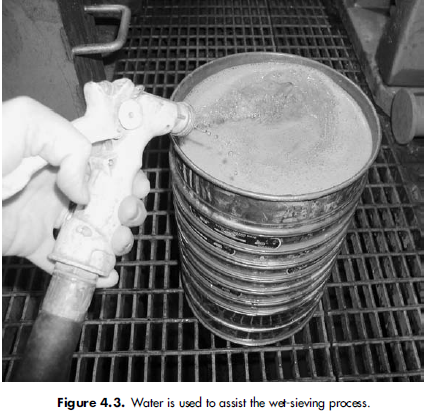
Samples of the discard and underflow streams are taken from the solids-control equipment for analysis. The density of all streams is measured. The volume flow rate of the discard stream is measured by capturing all of the discard stream in a container—a section of gutter works well at the discard end of a shaker screen. The volume flow rate of the discard stream is determined by multiplying the mass of fluid captured by the density, or mud weight, of the discard. The volume flow rate of the feed is determined by accurately measuring the flow rate from the rig pump. The mass flow rate of the feed is calculated by multiplying the density of the drilling fluid by the circulating flow rate. Each sample is wet sieved over a stack of U.S. Standard Sieves with a broad distribution of sizes. The excess drilling fluid is washed through the screen with the liquid phase of the drilling fluid. The samples at each individual sieve size are thoroughly dried. Weights of the solids retained at each individual sieve size are measured, and the flow rate for each stream at each individual sieve size is calculated. To determine the screen cut point curve, the quantity of a particular-size particle in the discard must be compared with the quantity of the same-size particles presented to the screen. All of the discard can be captured, and all of the mass of the discard solids of a particular size can be determined. However, it is impractical to try to capture and sieve all of the fluid passing through the screen during the period that the discard is being captured. For example, if the rig flow is 500 gpm and the discard sample is captured during a 3.50-min period, the underflow through the shaker screen would be 1750 gal. If the mud weight is 9.2 ppg, this means that 16,100 lb of drilling fluid has passed through the screen. A 9.2-ppg drilling fluid with no barite and 2.6 specific-gravity low-gravity solids would have 6.5% volume of solids. The total solids that would be presented to the screen during the 3.5-min period would be 113.75 gal [6.5% of 1750 gal] or 2467 lb of solids [(114 gal)(2.6)(8.34 ppg)]. Since it is not practical to capture and sieve this quantity of solids, a representative sample of the underflow through a screen can be used to determine the solids concentration and sizes that did pass through the screen. The flow rate of the underflow sample and the dry weight of the individual sieve sizes must be measured. This is the reason that flow rates of the dry solids are used in the calculations instead of using all of the solids captured in a specific time interval.
The corresponding feed mass flow rate (sum of discard and under flowrates) for each individual sieve size is also determined. The ratio of the discard and the feed flow rates at each sieve size determines the percentage of solids discarded over the solids-control equipment. The size of the sieves (expressed in microns) versus the percentage of solids removed produces a cut point curve.
A cut point curve graphically displays the fraction of various-size particles removed by the solids-control equipment compared with the quantity of that size of particle presented to the equipment. For example, a D50 cut point is the intersection of the 50% data point on the Y axis and the corresponding micron size on the X axis on the cut point graph. This cut point indicates the size of the particle in the feed to the solids control equipment that will have a 50% chance of passing through the equipment and a 50% chance of discharging off of the equipment. Frequently, solids-distribution curves are erroneously displayed as cut point curves. Cut point curves indicate the fraction of solids of various sizes that are separated. They also are greatly dependent on many drilling-fluid factors and indicate the performance of the complete solidscontrol device only at the exact moment in time of the data collection. The cut points of the solids-control equipment will be determined by the physical condition of the equipment and the properties of the drilling fluid.
Following is a procedure detailing the required steps to perform this method of particle-size analysis and the calculations used to create a cut point curve. An example of data collected and analyzed using a shale shaker is included after the detailed procedure. The example demonstrates useful information that can be obtained by following the procedure. This procedure is most applicable to performing cut point analysis with a shale shaker. Therefore, the example data measure solids to only 37 microns (No. 400 sieve).
Calculating cut point curves for hydrocyclones and centrifuges should use methods other than sieving. Measurements with a No. 635 sieve (20 microns) is about the limit of sieve analysis, but information is required about particles much smaller. Particle size analysis equipment, such as laser diffraction, is required for measurements of smaller sizes of solids. However, the assumption that the solids being analyzed have a constant density would have to be made.