FACTORS AFFECTING PERCENTAGE-SEPARATED CURVES

The relationship between the size and shape of the particles being separated and the size and shape of the screen openings will influence how fine a separation is made. This is reflected in the percentageseparated curve. If all of the solids being drilled are spherical, then the distribution of the narrowest dimension of the screen openings will establish the percentage-separated curve. For wells with poor drilling practices, cuttings are tumbled in the annulus and arrive well rounded at the surface. For wells that have good cuttings transport in the annulus, the cuttings may be long, thin slivers of rock.

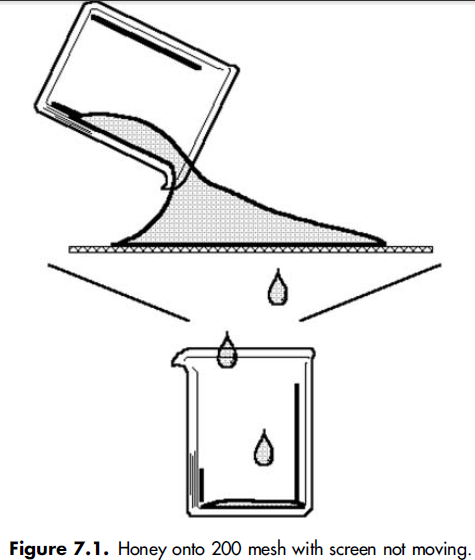
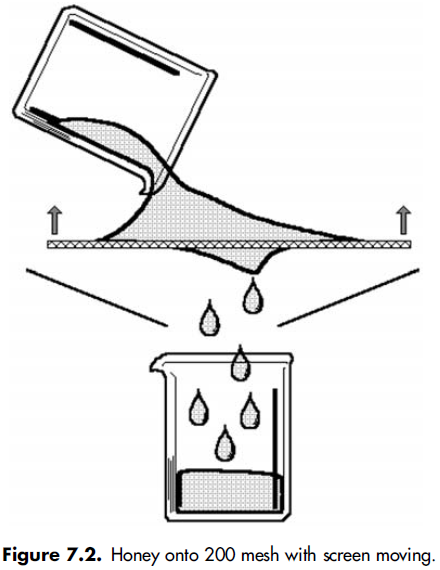
Solids have mobility in a pool of fluid to seek a screen opening large enough to go through. As a result, the conveyance velocity, contact time with the screen, and presence of other solids all affect the ability of the
solids to go through the holes in the screen. These variables therefore affect the percentage-separated curve.

Surface tension of the fluid causes solids to agglomerate together as they exit a pool of fluid. If solids finer than the screen openings make it out of the pool of fluid, then they are held by the surface tension and have very little chance to go through the screen. Adding a spray wash to the last screen panel disperses these patties, which will allow finer solids to be washed through the screen.

Blinding or plugging of screen cloth, as shown in Figure 7.24, dramatically affects not only the amount of fluid that will pass through the screen, but also the separation the screen makes. Many of the screen openings effectively become smaller, and fewer solids will pass through. The screen then makes a much finer separation than originally intended, and the screen capacity decreases significantly.

Reported values for percentage-separated curves are also affected by the way the measurement is made in the laboratory. The greatest error is often the measurement of particle size distribution. Particle sizing by sieve analysis is the best way to characterize solids being screened, since the sieving process is similar to screening. Unfortunately, sieving is a tedious and slow process. Forward laser-light-scattering particle size analyzers such as the Malvern and Cilas granulometers tend to report size distributions somewhat larger than sieve analysis. These instruments report particle sizes in terms of equivalent spherical diameters. Some drilled solids may be more rectangular in shape, so the equivalent spherical diameter may not exactly agree with the sieve analysis. Clay
particles in the 1-micron size are broad, flat surfaces, similar to a tabletop.These are difficult to describe in terms of a diameter.

Figure 7.24.Particles plugging wire mesh

In summary, the percentage-separated curve represents the fraction of solids rejected by the screen as a function of size. From the preceding discussion, it may be noted that the percentage-separated curve is dependent on the conditions that existed when the data were taken. As a result, in actual drilling conditions, the percentage-separated curve probably varies as drilling-fluid properties and the shapes of the solids change and as the screen blinds.

SHAKER SCREEN CLOTHS

Shale shakers remove solids by processing solids-laden drilling fluid over
the surface of a vibrating shaker screen. Particles smaller than the shaker screen openings pass through the screen along with the liquid phase of the drilling fluid.


Larger particles are separated into the shaker overflow for discard.
The shaker screen acts as a ‘go no-go’ gauge. That is, particles larger than
the screen openings remain on the screen and are discarded. Particles
finer than the screen openings go through the screen with the drilling
fluid. The criterion for early shale shaker screens was a long screen
life. This demand for screen life was consistent with the shaker designs
and solids-removal philosophies of the time period. Early shale shakers
could remove only large solids from the drilling fluid. The sand trap,
reserve and settling pits, and downstream hydrocyclones (if utilized)
removed the bulk of drilled solids. Today’s shale shakers are capable
of utilizing finer screens that remove more solids. Desirable characteristics
for a shaker screen are:
1. Economical drilled-solids removal
2. Large liquid flow rate capacity
3. Plugging and blinding resistance
4. Acceptable service life
5. Easy identification
For any particular shale shaker, the size and shape of the shaker screen openings have a great effect on solids removal. This means that the performance of any shaker is largely controlled by the screen cloth used.
The first four items in the preceding list are largely controlled by
choice of screen cloth and by the screen panel technology. Large gains
in shale shaker performance are a direct result of improved screen
cloth and panel fabrication. shaker Screens used on shale shakers have evolved into complex opening patterns.


How a shale shaker screens fluid

The primary purpose of a shale shaker is to remove as many drilled solids as possible without removing excessive amounts of drilling fluid. These dual objectives require that cuttings (or drilled solids) convey off the screen while simultaneously most of the drilling fluid is separated and removed from the cuttings. Frequently, the only stated objective of a shale shaker is to remove the maximum quantity of drilled solids. Stopping a shale shaker is the simplest way to remove the largest quantity of drilled solids. Of course, this will also remove most of the drilling fluid. When disregarding the need to conserve as much drilling fluid as possible, the ultimate objective of reducing drilling costs is defeated.
The size of drilled cuttings greatly influences the quantity of drilling fluid that tends to cling to the solids. As an extreme example, consider a golf-ball–size drilled solid coated with drilling fluid. Even with a viscous fluid, the volume of fluid would be very small compared with the volume of the solid. As the solids become smaller, the fluid film volume increases as the solids surface area increases. For silt-size or ultra-fine solids, the volume of liquid coating the solids may even be larger than the solids volume. More drilling fluid is returned to the system when very coarse screens are used than when screens as fine as API 200 are used.
Drilling fluid is a rheologically complex system. At the bottom of the hole, faster drilling is possible if the fluid has a low viscosity. In the annulus, drilled solids are transported better if the fluid has a high viscosity. When the flow stops, a gel structure builds slowly to prevent cuttings or weighting agents from settling. Drilling fluid is usually constructed to perform these functions. This means that the fluid viscosity depends on the history and the shear within the fluid. Typically, the low-shear-rate viscosities of drilling fluids range from 300–400 centipoise (cP) to 1000–1500 cP. As the shear rate (or, usually, the velocity) increases, drilling fluid viscosity decreases. Even with a low-shear-rate viscosity of 1500 cP, the plastic viscosity (or high-shear-rate viscosity) could be as low as 10 cP.
Drilling fluid flows downward, onto, and through shaker screens. If the shaker screen is stationary, a significant head would need to be applied to the drilling fluid to force it through the screen. Imagine pouring honey onto a 200-mesh screen (Figure 7.1). Honey at room temperature has a viscosity of around 100 to 200 cP. Flow through the screen would be very slow if the screen were moved rapidly upward through the honey (Figure 7.2), causing the honey to pass through the screen surface and into a collection device. These forces of vibration affect drilling fluid in the same manner. The introduction of vibration into this process applies upward and downward forces to the honey. The upward stroke moves the screen rapidly through the honey. These forces of vibration affect drilling fluid in the same manner. The upward stroke moves drilling fluid through the screen. Large solids do not follow the screen on the downward stroke, so they can be propelled from the screen surface.
When the screen moves on the downward stroke, the large solids are suspended above the screen and come in contact with the screen at a farther point toward the discharge end of the shaker. This is the reason that the elliptical, circular, and linear motion screens transport solids.

Screens are moved upward through the fluid with the elliptical, circular, and linear motion shale shakers. The linear motion shaker has an advantage because solids can be transported out of a pool of liquid and discharged from the system. The pool of liquid creates two advantages: Not only does it provide an additional head to the fluid, but it also provides inertia or resistance to the fluid as the screen moves upward. This significantly increases the flow capacity of the shaker. The movement of the shaker screen through the drilling fluid causes the screen to shear the fluid. This decreases the viscosity and is an effective component to allow the shaker to process drilling fluid.
The upward movement of the shaker screen through the fluid is similar to pumping the drilling fluid through the screen openings. If the fluid gels on the screen wires, the effective opening size is decreased. This would be the same as pumping drilling fluid through a smaller-diameter pipe. With the same head applied, less fluid flows through a smaller pipe in a given period of time than a larger pipe. If a shaker screen becomes water wet while processing NAF, the water ring around the screen opening effectively decreases the opening size available to pass the fluid. This, too, greatly reduces the flow capacity of the shaker.

Sample Calculation

During the drilling of a relatively uniform 2000-foot shale section, an API 200 continuous screen cloth was mounted on a linear shale shaker. An 11.2-ppg, freshwater, gel/lignosulfonate drilling fluid was circulated at 750 gpm while drilling. A typical set of samples will be described here.
Large pieces of shale were removed from the shaker screen and excess drilling fluid washed from the surface with distilled water. The shale pieces were ground and dried in an oven at 250F overnight. The shale was placed in a 173.91-cc pycnometer and weighed. Water was added to the pycnometer and pressurized to about 350 psi. The increase in weight of the pycnometer indicated the volume of water added to fill the pycnometer. (Room and water temperature was 68F, so the density of water was about 1.0 g/cc.) Subtracting this volume of water from the known volume of the pycnometer calculates the volume of shale sample. Once the volume of the shale sample and the weight were known, the density could be calculated. The shale drilled in this well had a density of 2.47 g/cc.
After movement of solids across the shale shaker screen appeared to be relatively uniform for more than 10 minutes, all the shaker discard was collected in a bucket. In 16.21 seconds, 3720.7 g of discard was captured. The discard rate was 13,772 g/min. The discard had a density of 1.774 g/cc or 14.8 ppg.
Calculation Procedure
A sample of the discard was placed in the pycnometer and weighed:
pycnometer+ sample weight = 869.68 g.
Since the pycnometer weighed 660.61 g dry and empty, the sample weight was 209.07 g.
The pycnometer with shaker discard sample was filled with distilled water, pressurized, and weighed:
pycnometer + sample +water =948.32 g.
The weight of water added was 948.32 g – 869.68 g=78.64 g. Volume of70°F. water added=78.64 g/0.998 g/cc.
Since the pycnometer volume was 173.91 cc, the sample volume was
173:91 cc -78:80 cc = 95:11 cc
The density of the sample was 209.07 g/95.11 cc=2.2 g/cc.
The objective of the shale shaker is to remove drilled solids, preferably without excessive quantities of drilling fluid. The fraction of the discard stream that is water, barite, and low-gravity solids can be determined by the preceding equations. These calculations indicate that the discard stream had 5.06 %vol barite, 38.38 %vol low-gravity solids, and 56.56 %vol water.
Calculation Procedure to Determine Low-Gravity Solids Discarded
The discard from the screen weighs 14.8 ppg and contains 43.44 %vol solids. We use the equation presented previously:

To determine the quantity of drilled solids discarded by the shale shaker, a sample of the discarded material was placed in a metal dish and dried in an oven overnight. The weight percentage of (wt%) dry solids was 68.11 and had a density of 2.78 g/cc.
The rate of dry solids discarded (RDSD) is calculated from the product of the wet discharge flow rate and the weight fraction of dry solids in the discharge (with the appropriate unit conversion factors):

Experimental and Calculation Procedure
A sample of discard was placed in a 40.10-g crucible and weighed:
crucible + sample weight = 114.94 g.
The wet sample weight was 74.84 g. Since the wet discard density was 1.77 g/cc, the wet sample had a volume of 74.84 g/1.77 g/cc=42.19 g/cc.
After heating overnight at 250°F, the crucible and sample weight were 91.08 g. The dry solids weight in the sample was 91.08 g- 40.10 g=50.98 g.
The wt% dry solids in the discard was the weight of dry solids divided by the wet-sample weight times 100, or
[50.98 g/74.84 g]× 100=68.12 wt%.
The volume of the dry sample was calculated by subtracting the volume of water lost from the volume of the wet sample:
The 42.19-cc wet sample lost 114.94 cc-91.08 cc=23.86 cc of water.
The volume of the dry sample was 42.19 cc-23.86 cc=18.33 cc.
The density of the dry solids was the weight of dry solids divided by the volume of dry solids, or 50.98 g/18.33 cc=2.78 g/cc.
Calculation of Barite Discarded by Shale Shaker
Assuming that all of the drilled and other low-gravity solids in the drilling fluid have a dried density of 2.47 g/cc and the barite has a density of 4.2 g/cc, the wt% barite in the dry sample may be calculated from the mass-balance equation:
Density of Dry Solids =Weight of Solids/Volume of Solids
or
Density of Dry Solids=[Weight of Barite+ Weight of Low Gravity Solids]/[Volume of Barite + Volume of Low Gravity Solids]
To determine the terms on the right side of the equation:
1. The volume of barite is the density (4.2 g/cc) divided by the weight of barite.
2. The volume of low-gravity solids is the total volume of dry solids minus the volume of barite.
3. The volume of low-gravity solids in 1 cc of solids equals 1 cc minus the volume of barite in 1 cc of solids.
Volume of low gravity solids in 1 cc of solids=1cc-[Wb/4.2 g/cc]
Weight of Low Gravity Solids in 1 cc of dry solids={1cc-[Wb/4.2 g/cc]}×(2.47 g/cc)
Density of Solids (D)={WB+ 2:47 g/cc[1 -WB/4.2 g/cc]×1 cc}/[Wb/4.2 g/cc]+{1-[Wb/4.2 g/cc]}
This equation may be reduced to the expression:
D = 0:4119WB + 2.47
or
Weight percent barite=D-2.47/0.4119
The discard density is 2.78 g/cc, so the wt% barite is 27.07. The weight of dry discard from the shaker screen is 1239 lb/hr. The quantity of barite discarded is (0.2707)(1239 lb/hr), or 377 lb/hr. The low-gravity-solids discard rate is 1239 lb/hr-377 lb/hr, or 862 lb/hr.
Calculation of Solids Discarded as Whole Drilling Fluid
A water-base drilling fluid contains 13% volume of solids in the liquid phase of the shale shaker discard, which could be associated with the whole drilling fluid.
The wt% dry solids discarded from the shaker screen is calculated to be 68.12; so 31.89% of the discard must be liquid. Assume that this liquid is composed of drilling fluid with the solids distribution of the drilling fluid in the pits. The liquid discard rate is (13,772 g/min)(0.3189), or 4391.9 g/min. This liquid should contain 13% volume of solids.
Since the drilling fluid contains 13% volume of solids, a 100 cc sample contains 87 cc of liquid. In this 100 cc sample, the water fraction wouldweigh 87 g. With an 11.2-ppg (1.343 g/cc) density drilling fluid, the 100 cc sample should weigh 134.3 g. Since the liquid weighs 87 g, the solids must weigh 47.3 g. Or, stated another way, the drilling fluid contains 47.3 g of solids for every 87 g of water. The total liquid discard rate is 4391.9 g/min. The solids discarded by the screen that are associated with the drilling fluid would be:
[47:3 g solids/87 g water][4391:9g/min]=2387.8g/min; or 315:6 lb/hr.
The wt% barite in the drilling fluid is 77.4 and the wt% low-gravity solids in the drilling fluid is 22.4. From the solids discarded from the screen associated with the whole drilling fluid, 244 lb/hr are barite and 71.2 lb/hr are low-gravity solids.
Previously, the dry solids discarded by the shaker screen were calculated to be 377 lb/hr barite and 861 lb/hr low-gravity solids. Subtracting the solids associated with the drilling fluid from the solids removed by the screen indicates the discarded solids in excess of those associated with the drilling fluid:
Barite:
377 lb/hr – 244 lb/hr = 133 lb/hr
Low-gravity solids:
861.0 lb/hr – 71.2 lb/hr = 789.8 lb/hr
This indicates that the API 200 screen is removing 133 lb/hr of barite and almost 800 lb/hr of drilled solids in addition to the quantity contained in the associated drilling fluid.
Note that the technique of using the concentration of barite in the discard does not allow an accurate measurement of the quantity of drilling fluid in the shaker discard. Some measurements even indicate that less barite is in the discard than is in the whole drilling fluid. Shaker screens can pass much of the small-size barite and remove it from the liquid before it is discarded by the shaker screen.