Tank arrangement

The purpose of a drilling rig surface fluid processing system is to provide a sufficient volume of properly treated drilling fluid for drilling operations. The active system should have enough volume of properly conditioned drilling fluid above the suction and equalization lines to keep the well bore full during wet trips.
The surface system needs to have the capability to keep up with the volume-building needs while drilling; otherwise, advanced planning and premixing of reserve mud should be considered. This should be planned for the worst case, which would be a bigger-diameter hole in which high penetration rates are common. For example for a 14-3/4-inch hole section drilling at an average rate of 200 ft/hr and with a solids-removal efficiency of 80%, the solids-removal system will be removing approximately 34 barrels of drilled solids per hour plus the associated drilling fluid coating these solids. More than likely, 2 barrels of drilling fluid would be discarded per barrel of solids. If this is the case, the volume of drilling fluid in the active system will decrease by 102 barrels per hour. If the rig cannot mix drilling fluid fast enough to keep up with these losses, reserve mud and or premixed drilling fluid should be available to blend into the active system to maintain the proper volume.
The surface system should consist of three clearly identifiable sections (Figure 5.1):

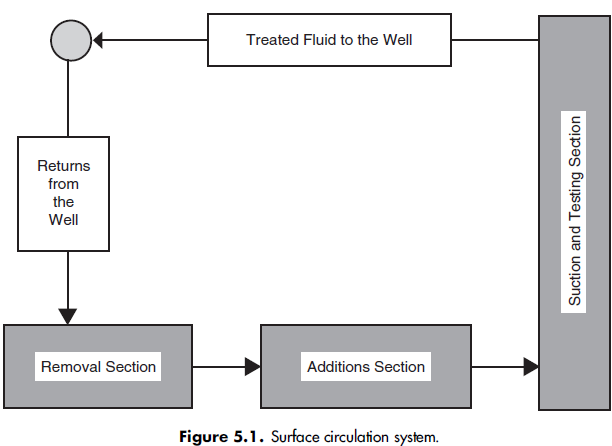
. Suction and testing section
. Additions section
. Removal section
1.ACTIVE SYSTEM
1.1 Suction and Testing Section
The suction and testing section is the last part of the surface system. Most of the usable surface volume should be available in this section. Processed and treated fluid is available for various evaluation and analysis procedures just prior to the fluid recirculating downhole. This section should be mixed, blended, and well stirred. Sufficient residence time should be allowed so that changes in drilling-fluid properties may be made before the fluid is pumped downhole. Vortex patterns from agitators should be inhibited to prevent entraining air in the drilling fluid.
In order to prevent the mud pumps from sucking air, vertical baffles can be added in the tank to break up the possible vortex patterns caused by the agitators. If the suction tank is ever operated at low volume levels, additional measures should be taken to prevent vortexing, such as adding a flat plate above the suction line to break up the vortex pattern.
Proper agitation is very important, so the drilling fluid is a homogeneous mixture in both the tank and the well bore. This is important because if a ‘‘kick’’ (entrance of formation fluid into the well bore due to a drop in hydrostatic pressure) occurs, an accurate bottom-hole pressure can be calculated. The well-control procedures are based on the required bottom-hole pressure needed to control the formation pressures. If this value is not calculated correctly, the well bore will see higher than
necessary pressures during the well-control operation. With higher than required pressure, there is always the risk of fracturing the formation. This would bring about additional problems that would be best avoided whenever possible. For agitator sizing, see Chapter 10 on Agitation.
1.2 Additions Section
All commercial solids and chemicals are added to a well-agitated tank upstream from the suction and testing section. New drilling fluid mixed on location should be added to the system through this tank. Drilling fluid arriving on location from other sources should be added to the system through the shale shaker to remove unwanted solids.
To assist homogeneous blending, mud guns may be used in the additions section and the suction and testing section.
1.3 Removal Section
Undesirable drilled solids and gas are removed in this section before new additions are made to the fluid system. Drilled solids create poor fluid properties and cause many of the costly problems associated with drilling wells. Excessive drilled solids can cause stuck drill pipe, bad primary cement jobs, or high surge and swab pressures, which can result in lost circulation and/or well-control problems. Each well and each type of drilling fluid has a different tolerance for drilled solids.
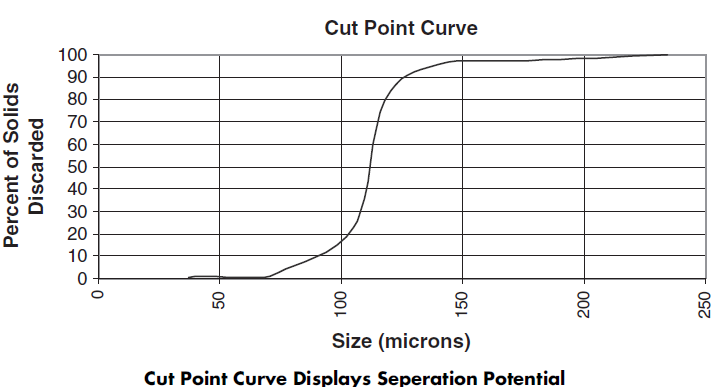
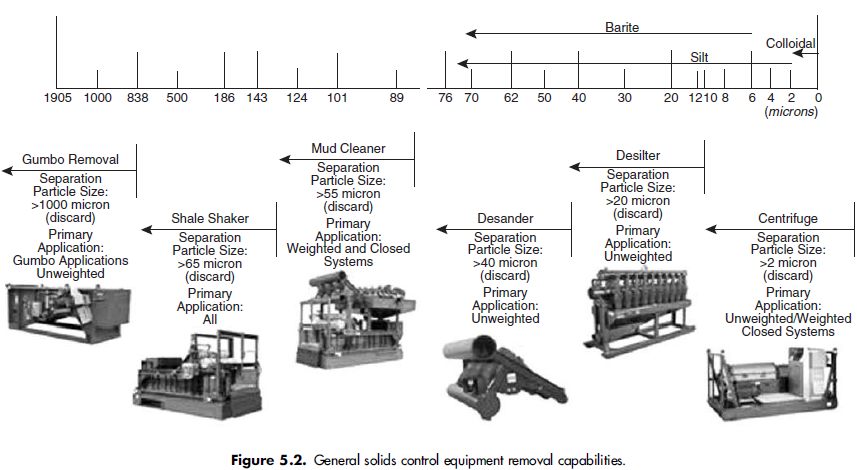
Each piece of solids-control equipment is designed to remove solids within a certain size range. Solids-control equipment should be arranged to remove sequentially smaller and smaller solids. A general range of sizes is presented in Table 5.1 and in Figure 5.2.

Equipment Size Median Size of Removed Microns
Shale Shakers API 80 screen 177
  API 120 screen 105
  API 200 screen 74
Hydrocyclones (diameter) 8-inch 70
  4-inch 25
  3-inch 20
Centrifuge    
Weighted mud   >5
Unweighted mud   <5

The tanks should have adequate agitation to minimize settling of solids and to provide a uniform solids/liquid distribution to the hydrocyclones and centrifuges. Concerning the importance of proper agitation in the operation of hydrocyclones, efficiency can be cut in half when the suction tank is not agitated, versus one that is agitated. Unagitated suction tanks usually result in overloading of the hydrocyclone or plugged apexes. When a hydrocyclone is overloaded, its removal efficiency is reduced. If the apex becomes plugged, no solids removal occurs and its efficiency then becomes zero. Agitation will also help in the removal of gas, if any is present, by moving the gaseous drilling fluid to the surface of the tank, providing an opportunity for the gas to break out.
Mud guns can be used to stir the tanks in the additions section provided careful attention is paid to the design and installation of the mud gun system. If mud guns are used in the removal section, each mud gun should have its own suction and stir only that particular pit. If manifolding is added to connect all the guns together, there is a high
potential for incorrect use, which can result in defeating proper sequential separation of the drilled solids in an otherwise well-designed solids removal setup. Manifolding should be avoided.
1.4 Piping and Equipment Arrangement
Drilling fluid should be processed through the solids-removal equipment in a sequential manner. The most common problem on drilling rigs is improper fluid routing, which causes some drilling fluid to bypass the sequential arrangement of solids-removal equipment. When a substantial amount of drilling fluid bypasses a piece or pieces of solids-removal equipment, many of the drilled solids cannot be removed. Factors that contribute to inadequate fluid routing include ill-advised manifolding of
centrifugal pumps for hydrocyclone or mud cleaner operations, leaking valves, improper setup and use of mud guns in the removal section, and routing of drilling fluid incorrectly through mud ditches.
Each piece of solids-control equipment should be fed with a dedicated, single-purpose pump, with no routing options. Hydrocyclones and mud cleaners have only one correct location in tank arrangements and therefore should have only one suction location. Routing errors should be corrected and equipment color-coded to eliminate alignment errors. If worry about an inoperable pump suggests manifolding, it would be cost saving to allow easy access to the pumps and have a standby pump
in storage. A common and oft-heard justification for manifolding the pumps is, ‘‘I want to manifold my pumps so that when my pump goes down, I can use the desander pump to run the desilter.’’ What many drilling professionals do not realize is that improper manifolding and centrifugal-pump operation is what fails the pumps by inducing cavitation. Having a dedicated pump properly sized and set up with no opportunity for improper operation will give surprisingly long pump life as well as process the drilling fluid properly.
Suction and discharge lines on drilling rigs should be as short and straight as possible. Sizes should be such that the flow velocity within the pipe is between 5 and 10 ft/sec. Lower velocities will cause settling problems, and higher velocities may induce cavitation on the suction side or cause erosion on the discharge side where the pipe changes direction. The flow velocity may be calculated with the equation:
Velocity, ft/sec=Flow rate, gpm/2.48(insided diameter in)^2
Pump cavitation may result from improper suction line design, such as inadequate suction line diameter, lines that are too long, or too many bends in the pipe. The suction line should have no elbows or tees within three pipe diameters of the pump section flange, and their total number should be kept to a minimum. It is important to realize that an 8-inch, 90° welded ell has the same frictional pressure loss as 55 feet of straight 8-inch pipe. So, keep the plumbing fixtures to a minimum.

Cut point data:shale shaker example

Create a shale shaker cut point curve using the following known data:
. Well flow rate=560 gpm
. Density of feed=8.90 lb/gal
. Container used to collect effluent sample=1.80 lb
. Total effluent sample and container weight=41.5 lb
. Trough used to collect discard sample=38.1 lb
. Time to collect the discard sample=1.00 minute
. Total discard sample and trough weight=56.5 lb
1. Calculate the mass flow rate of the system=560 gpm*8.90 lb/gal=4984 lb/min.
2. Determine the weight of the effluent sample=41.5 lb-1.80 lb=39.7 lb.
3. After sieving, drying, and weighing the effluent solids, document the individual weights of the solids on each size sieve.
4. Calculate the weight of the discard sample=56.5 lb-38.1 lb=18.4 lb.
5. After sieving, drying, and weighing the discard solids, record the individual weights of the solids on each size sieve.
6. Calculate the wet discard flow rate=18.4 lb / 1.00 minute=18.4 lb/min.
7. Calculate the effluent flow rate=4984 lb/min-18.4 lb/min=4965.6 lb/min.
8. Calculate the effluent sample time=39.7 lb / 4965.6 lb/min=0.008 minutes
9. Determine the rate of solids collected on each individual sieve size for the discard sample.
Example for 37 micron sieve=8.80 grams /1.00 minute=8.80 grams/minute
10. Determine the rate of solids collected on each individual sieve size for the effluent sample.
Example for 37 micron sieve=17.7 grams /0.008 minutes=2214 grams/minute
11. Determine the feed flow rate for each sieve size. Example for 37 micron sieve = 9 grams/minute + 2214 grams/minute = 2223 grams/minute
12. Calculate the percent of discard solids for each sieve size. Example for 37 micron sieve=(8.80 grams/minute / 2223 grams/minute)*100=0.40%
13. Plot the sieve sizes versus the percent discard


How to determine cut points curves

1. If a flow meter is unavailable, determine the flow rate to the solids control equipment. To calculate the flow rate, one must know the fluid pump’s gallons per stroke, strokes per minute, and efficiency.
The flow rate can then be calculated by:
flowrate = (cylinder volume * N)(spm) (pump efficiency)
where
. cylinder volume=(((pump sleeve inner diameter in inches)^2* π)/4)*pump stroke length in inches (0.00433 in^3/gal)
. N=number of pump cylinders
. (spm)=strokes per minute
2. Take a representative sample from the feed stream and measure the density.
Underflow:
1. Weigh the sampling container. A minimum container size of 5 gal is recommended in order to capture a large sample of solids.
2. Take a representative sample from the underflow (effluent) stream of the solids-control equipment system (Figure 4.1; note that using a smaller container to fill the larger sampling container will not adversely affect the solids sample).

3. Weigh the sampling container and effluent sample.
4. Calculate the weight of the effluent sample: weight of effluent sample = effluent sample and container – weight of container
5. Wet sieve and dry the sieved solids thoroughly. Slowly pour the collected sample through a stack of U.S. Standard Sieve screens with a broad distribution of micron opening sizes (see Section 4.2 for a representative distribution of sieve sizes). A gentle stream of water is used to wash the solids and to assist the sieving process (Figures 4.2 and 4.3). Once the sample has completely passed through the stack of sieves, each sample of solids on each individual sieve must be dried. Drying can be accomplished by placing the sample in a static oven(1) and heating at a maximum temperature of 250°F until all of the water has evaporated. If an oven is unavailable, the samples may also be allowed to slowly air dry.

6. Measure the weight of dry solids captured on each size of sieve screen. These will be the weights of individual dry effluent solids.
Discard:
1. Weigh the trough that will be used to collect the discard sample.
2. Collect the discard sample off the end of the solids-control equipment(Figure 4.4).

3. Measure the time (in minutes) for which all the discard is collected from the solids-control equipment. This will be the time of discard sample.
4. Weigh the discard sample and trough.
5. Calculate the weight of the discard sample in the trough: wet discard sample weight = discard sample and trough – weight of trough
6. Wet sieve and dry the sieved solids thoroughly.(2)
Take a representative sample from the discarded solids and slowly pour through a stack of U.S. Standard Sieve screens. Use the same sizes of sieves used for the underflow sample, and follow the same procedure: Wash the solids with a gentle stream of water, which also assists the sieving process (Figures 4.2 and 4.3). Once the sample has completely passed through the stack of sieves, dry each sample of solids on each individual sieve. Drying can be accomplished by placing the sample in a static oven(3) and heating at a maximum temperature of 250°F until all of the water has evaporated. If an oven is unavailable, the samples may also be allowed to slowly air dry.
7. Measure the weight of dry solids captured on each size of sieve screen.These will be the weights of individual dry discard solids
Plotting the Cut Point Curve
1. Determine the wet discard flow rate:
wet discard flow rate = wet discard sample weight/time of discard sample.
2. Determine the effluent flow rate:
effluent flow rate = well flow rate – wet discard flow rate.
3. Calculate the time taken for the effluent sample:
effluent sample time = weight of effluent sample/effluent flow rate.
4. For each U.S. Standard Sieve screen size, determine the rate of solids collected for the discard sample:
discard flow rate = weight of individual dry discard solids/time of discard sample.
5. For each U.S. Standard Sieve screen size, determine the rate of solids collected for the effluent sample:
effluent flow rate = weight of individual dry effluent solids=/effluent sample time.
6. Determine the feed flow rate for each sieve size:
feed flow rate = dry discard flow rate + effluent flow rate.
7. Calculate the percentage of discarded solids for each sieve size:
percentage of discard = (discard flow rate/feed flow rate) / 100.
8. Plot the percentage of discard on the Y axis with the corresponding sieve size (expressed in microns) along the X axis of a graph to produce the cut point curve for the analyzed system. The cut point curve would actually be a series of horizontal lines between sieve sizes. The curve is usually drawn through the center of each segment to
produce a smooth curve.

(1)This method applies to water-base fluids only. For oil-base fluids, proper cleansing and drying of the sample should be administered in order to extract all residual fluids from the solids.

(2)This method applies to water-base fluids only. For oil-base fluids, proper cleansing and drying of the sample should be administered in order to extract all residual fluids from the solids.

(3)This method applies to water-based fluids only. For oil-based fluids, paper cleansing and drying of the sample should be administered in order to extract all residual fluids from the solids.

CUT POINTS

Cut points are used to indicate the separation characteristics of solids control equipment at a given moment in time. The performance of the equipment, in addition to the condition of the drilling fluid, should be taken into consideration in the assessment of cut point data. Cut point curves are derived from the collected data and indicate, at the actual moment of data collection, the percentage of chance that a particle of a particular size can flow through or be discarded by the solids-control equipment. Therefore, the cut point curve is a function of the physical properties of the solids (i.e., density), particle size distribution of the solids, physical condition of the solids-control equipment (i.e., sealing capabilities), and the drilling-fluid properties.
Cut points may be determined for all drilled-solids removal equipment. The mass flow rate of various-size particles discarded from the equipment is compared with the mass flow rate of the same-size particles presented to the equipment. When testing a particular unit, knowledge of the feed flow rate to the unit and the two discharge flow rates are required. The density of the feed flow multiplied by the volume flow rate provides the mass flow rate into the unit. Discharge mass flow rates are also calculated by multiplying the density of the stream by the volume flow rate. Obviously, the sum of the discharge mass flow rates must be equal to the feed mass flow rate. Usually one of the discharge flow streams is discarded and the other is retained in the drilling fluid.The material balance—both the volume flow rate balance and the mass flow rate balance—should be verified before measuring the particle sizes of the various streams.
Solids-removal equipment removes only a very small fraction of the total flow into the equipment. For example, a 4-inch desilter processing about 50 gpm of drilling fluid will discard only about 1 gpm of material. Since the discarded material is such a small proportion of the total material processed, the difference between the retained stream and the feed stream is difficult to measure. For this reason, more accurate data are acquired by mathematically adding the value of the discarded solid concentrations to that of the retained solids concentration to determine the feed solids concentration.
To determine the mass flow of a particular-size particle in the feed (or retained) stream and the mass flow of the same-size particle in the discard, flow rate measurements and solids concentrations are needed. The discard volume flow rates are normally relatively low, but the feed rates require using a flow meter or a positive displacement pump.
For shale shakers, the feed to the shaker will be the circulating rate coming from the well. Mud pumps must be calibrated to provide an accurate feed rate. While drilling, move the suction from the suction tank to the slug tank and measure the rate of drop of the fluid leaving the slug pit. The fluid in the slug tank will contain liquid and gas (or air), so the volume percentage of (%vol) gas must be subtracted from the volume of fluid leaving the slug tank. The %vol gas is calculated by dividing the difference between the pressurized mud weight and the unpressurized mud weight by the pressurized mud weight and multiplying by 100. If the desilters or centrifuges are fed by centrifugal pumps, some type of flow meter will be required to accurately determine the feed rate. The flow meter could be a large container whose volume is calibrated and a stopwatch. A centrifuge underflow volume flow rate is difficult to measure because of the high concentration of solids. A barrel or other large container can be split vertically and support beams or pipes welded to provide a support when the container is placed across the top of a mud tank. Calibrated lines are painted inside of the container to provide volume measurements. A quantity of water is placed in the container and the container is positioned adjacent to a decanting centrifuge mounted on top of a mud tank. The stopwatch is started when the container is pushed under the centrifuge, and the rate of water level is observed.
The known volume between lines and the time permit calculation of the volume discard rate. Representative samples of the underflow or heavy slurry provide the density measurements of the underflow. After confirming that there is a mass and volume flow balance with the measured values, the particle sizes in the discharge streams are determined.
All of the discard stream may be captured for analysis during a period of several minutes. The contents of the feed stream during that period must be known so that the ratio of discard to feed particle mass can be determined for various particle sizes. The feed stream and retained stream for shakers and desilters, however, would require much larger containers, and it is impractical to try to weigh or measure their volumes directly. Representative samples of the retained stream must be used to determine the mass of various-size particles.
With the centrifuge and the desilters, the particle sizes must be measured with an instrument that discerns particle sizes as small as 1 micron. With the shaker measurements, sieves may be used because the cut point range will be within the range of screens standardized by the American Society for Testing and Materials (ASTM). A variety of different laboratory devices are available that measure small-diameter particles. Instruments using lasers are popular in many laboratories.
The discard sample will contain the solids and the liquid phase of the drilling fluid. With the shale shaker discard, the mass of solids retained on each ASTM test screen may be measured directly by weighing the solids after they are dried. With the desilter underflow and the centrifuge underflow (or heavy slurry) discharge, the density of the solids must be used to determine the mass percentage of solids.
Cut points for shale shakers are measured by determining the particle size distribution of the feed and discard streams with the use of a stack of U.S. Standard Sieves. The flow rate of each stream is determined, and the mass flow rate for each sieve size in each stream is calculated. The mass flow rate of the discard stream for each sieve size is divided by the mass flow rate for the same size introduced into the equipment in the feed stream.
Using this method, the feed-stream sample represents a small fraction of the total overall flow. This can create a problem with material balances. A better method is to sample the discard and underflow streams. Combining these two solids distributions will yield a more accurate cut point curve. This method can be used on solids-control equipment in which the feed-stream flow rate is greater than the discard stream.
Samples of the discard and underflow streams are taken from the solids-control equipment for analysis. The density of all streams is measured. The volume flow rate of the discard stream is measured by capturing all of the discard stream in a container—a section of gutter works well at the discard end of a shaker screen. The volume flow rate of the discard stream is determined by multiplying the mass of fluid captured by the density, or mud weight, of the discard. The volume flow rate of the feed is determined by accurately measuring the flow rate from the rig pump. The mass flow rate of the feed is calculated by multiplying the density of the drilling fluid by the circulating flow rate. Each sample is wet sieved over a stack of U.S. Standard Sieves with a broad distribution of sizes. The excess drilling fluid is washed through the screen with the liquid phase of the drilling fluid. The samples at each individual sieve size are thoroughly dried. Weights of the solids retained at each individual sieve size are measured, and the flow rate for each stream at each individual sieve size is calculated. To determine the screen cut point curve, the quantity of a particular-size particle in the discard must be compared with the quantity of the same-size particles presented to the screen. All of the discard can be captured, and all of the mass of the discard solids of a particular size can be determined. However, it is impractical to try to capture and sieve all of the fluid passing through the screen during the period that the discard is being captured. For example, if the rig flow is 500 gpm and the discard sample is captured during a 3.50-min period, the underflow through the shaker screen would be 1750 gal. If the mud weight is 9.2 ppg, this means that 16,100 lb of drilling fluid has passed through the screen. A 9.2-ppg drilling fluid with no barite and 2.6 specific-gravity low-gravity solids would have 6.5% volume of solids. The total solids that would be presented to the screen during the 3.5-min period would be 113.75 gal [6.5% of 1750 gal] or 2467 lb of solids [(114 gal)(2.6)(8.34 ppg)]. Since it is not practical to capture and sieve this quantity of solids, a representative sample of the underflow through a screen can be used to determine the solids concentration and sizes that did pass through the screen. The flow rate of the underflow sample and the dry weight of the individual sieve sizes must be measured. This is the reason that flow rates of the dry solids are used in the calculations instead of using all of the solids captured in a specific time interval.
The corresponding feed mass flow rate (sum of discard and under flowrates) for each individual sieve size is also determined. The ratio of the discard and the feed flow rates at each sieve size determines the percentage of solids discarded over the solids-control equipment. The size of the sieves (expressed in microns) versus the percentage of solids removed produces a cut point curve.
A cut point curve graphically displays the fraction of various-size particles removed by the solids-control equipment compared with the quantity of that size of particle presented to the equipment. For example, a D50 cut point is the intersection of the 50% data point on the Y axis and the corresponding micron size on the X axis on the cut point graph. This cut point indicates the size of the particle in the feed to the solids control equipment that will have a 50% chance of passing through the equipment and a 50% chance of discharging off of the equipment. Frequently, solids-distribution curves are erroneously displayed as cut point curves. Cut point curves indicate the fraction of solids of various sizes that are separated. They also are greatly dependent on many drilling-fluid factors and indicate the performance of the complete solidscontrol device only at the exact moment in time of the data collection. The cut points of the solids-control equipment will be determined by the physical condition of the equipment and the properties of the drilling fluid.
Following is a procedure detailing the required steps to perform this method of particle-size analysis and the calculations used to create a cut point curve. An example of data collected and analyzed using a shale shaker is included after the detailed procedure. The example demonstrates useful information that can be obtained by following the procedure. This procedure is most applicable to performing cut point analysis with a shale shaker. Therefore, the example data measure solids to only 37 microns (No. 400 sieve).
Calculating cut point curves for hydrocyclones and centrifuges should use methods other than sieving. Measurements with a No. 635 sieve (20 microns) is about the limit of sieve analysis, but information is required about particles much smaller. Particle size analysis equipment, such as laser diffraction, is required for measurements of smaller sizes of solids. However, the assumption that the solids being analyzed have a constant density would have to be made.