

1. If a flow meter is unavailable, determine the flow rate to the solids control equipment. To calculate the flow rate, one must know the fluid pump’s gallons per stroke, strokes per minute, and efficiency.
The flow rate can then be calculated by:
flowrate = (cylinder volume * N)(spm) (pump efficiency)
where
. cylinder volume=(((pump sleeve inner diameter in inches)^2* π)/4)*pump stroke length in inches (0.00433 in^3/gal)
. N=number of pump cylinders
. (spm)=strokes per minute
2. Take a representative sample from the feed stream and measure the density.
Underflow:
1. Weigh the sampling container. A minimum container size of 5 gal is recommended in order to capture a large sample of solids.
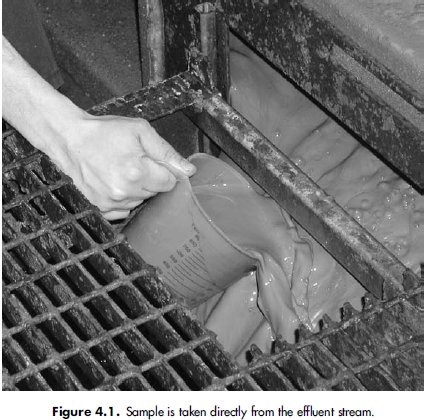
2. Take a representative sample from the underflow (effluent) stream of the solids-control equipment system (Figure 4.1; note that using a smaller container to fill the larger sampling container will not adversely affect the solids sample).
3. Weigh the sampling container and effluent sample.
4. Calculate the weight of the effluent sample: weight of effluent sample = effluent sample and container – weight of container
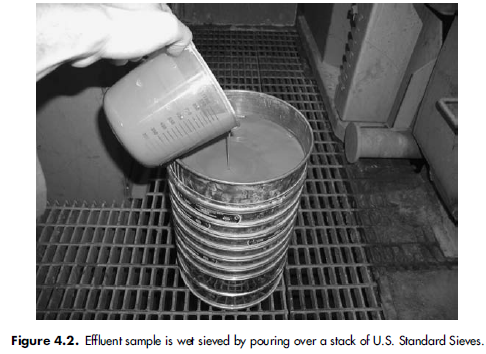
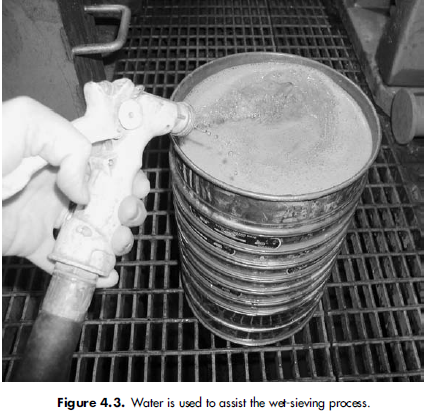
5. Wet sieve and dry the sieved solids thoroughly. Slowly pour the collected sample through a stack of U.S. Standard Sieve screens with a broad distribution of micron opening sizes (see Section 4.2 for a representative distribution of sieve sizes). A gentle stream of water is used to wash the solids and to assist the sieving process (Figures 4.2 and 4.3). Once the sample has completely passed through the stack of sieves, each sample of solids on each individual sieve must be dried. Drying can be accomplished by placing the sample in a static oven(1) and heating at a maximum temperature of 250°F until all of the water has evaporated. If an oven is unavailable, the samples may also be allowed to slowly air dry.
6. Measure the weight of dry solids captured on each size of sieve screen. These will be the weights of individual dry effluent solids.
Discard:
1. Weigh the trough that will be used to collect the discard sample.
2. Collect the discard sample off the end of the solids-control equipment(Figure 4.4).

3. Measure the time (in minutes) for which all the discard is collected from the solids-control equipment. This will be the time of discard sample.
4. Weigh the discard sample and trough.
5. Calculate the weight of the discard sample in the trough: wet discard sample weight = discard sample and trough – weight of trough
6. Wet sieve and dry the sieved solids thoroughly.(2)
Take a representative sample from the discarded solids and slowly pour through a stack of U.S. Standard Sieve screens. Use the same sizes of sieves used for the underflow sample, and follow the same procedure: Wash the solids with a gentle stream of water, which also assists the sieving process (Figures 4.2 and 4.3). Once the sample has completely passed through the stack of sieves, dry each sample of solids on each individual sieve. Drying can be accomplished by placing the sample in a static oven(3) and heating at a maximum temperature of 250°F until all of the water has evaporated. If an oven is unavailable, the samples may also be allowed to slowly air dry.
7. Measure the weight of dry solids captured on each size of sieve screen.These will be the weights of individual dry discard solids
Plotting the Cut Point Curve
1. Determine the wet discard flow rate:
wet discard flow rate = wet discard sample weight/time of discard sample.
2. Determine the effluent flow rate:
effluent flow rate = well flow rate – wet discard flow rate.
3. Calculate the time taken for the effluent sample:
effluent sample time = weight of effluent sample/effluent flow rate.
4. For each U.S. Standard Sieve screen size, determine the rate of solids collected for the discard sample:
discard flow rate = weight of individual dry discard solids/time of discard sample.
5. For each U.S. Standard Sieve screen size, determine the rate of solids collected for the effluent sample:
effluent flow rate = weight of individual dry effluent solids=/effluent sample time.
6. Determine the feed flow rate for each sieve size:
feed flow rate = dry discard flow rate + effluent flow rate.
7. Calculate the percentage of discarded solids for each sieve size:
percentage of discard = (discard flow rate/feed flow rate) / 100.
8. Plot the percentage of discard on the Y axis with the corresponding sieve size (expressed in microns) along the X axis of a graph to produce the cut point curve for the analyzed system. The cut point curve would actually be a series of horizontal lines between sieve sizes. The curve is usually drawn through the center of each segment to
produce a smooth curve.
(1)This method applies to water-base fluids only. For oil-base fluids, proper cleansing and drying of the sample should be administered in order to extract all residual fluids from the solids.
(2)This method applies to water-base fluids only. For oil-base fluids, proper cleansing and drying of the sample should be administered in order to extract all residual fluids from the solids.
(3)This method applies to water-based fluids only. For oil-based fluids, paper cleansing and drying of the sample should be administered in order to extract all residual fluids from the solids.
